Fantasy Basketball Analyzer
Fantasy Basketball Analyzer
The Fantasy Basketball Analyzer was developed with the intent of providing compact and relevant statistical information about basketball players to better inform trades and add/dropping players to free agency.
This program was developed using Python, leveraging NBA_API for pulling data from NBA website, TKinter for user input and Matplotlib for visualization of data. I was the exclusive developer for this program.
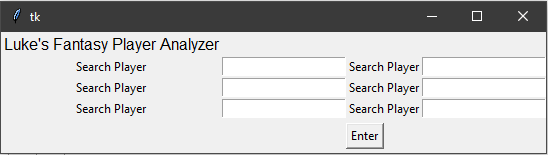
Robust Input
The user is able to input up to 6 names for comparison. The NBA API has a robust search method, allowing for partial names (i.e. ‘Lebron’ or ‘Giannis’). The Fantasy Basketball Analyzer has been designed to be robust against empty name entries, misspelled names and no name matches.


Relevant Output
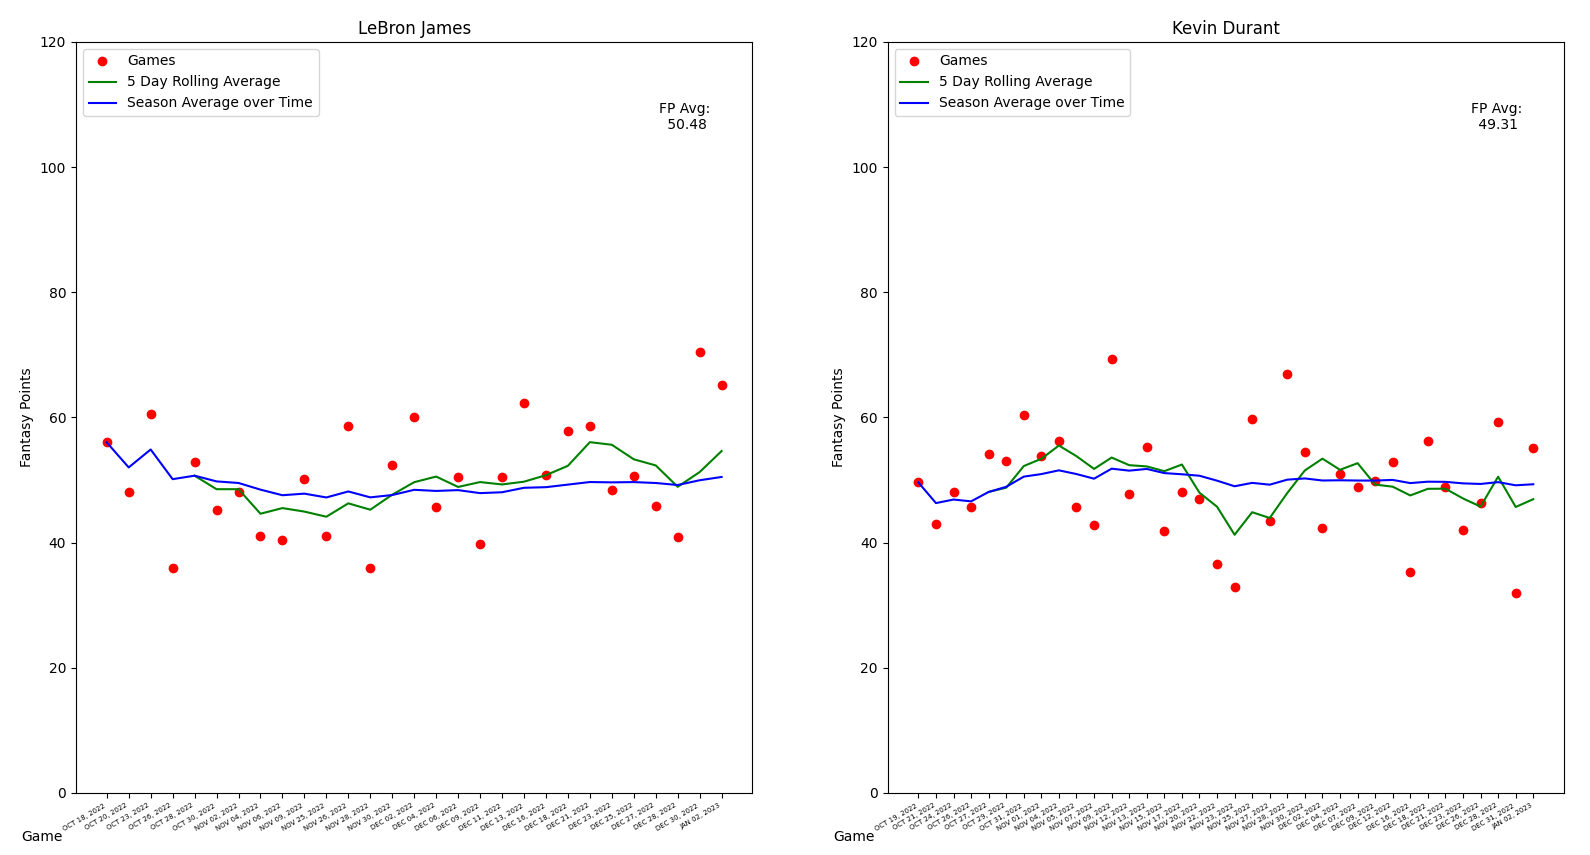
Rolling Averages
For each game in the season, the number of fantasy points scored is calculated and plotted against time. This scatter plot of data (red) is the base data, which can be viewed within the fantasy league. The 5 day rolling average (green) helps understand who is performing above or below there season average, or who is the hot player to pick up in free agency. Finally, the season average over time (blue) can help ascertain which players are falling or rising as the season progresses.
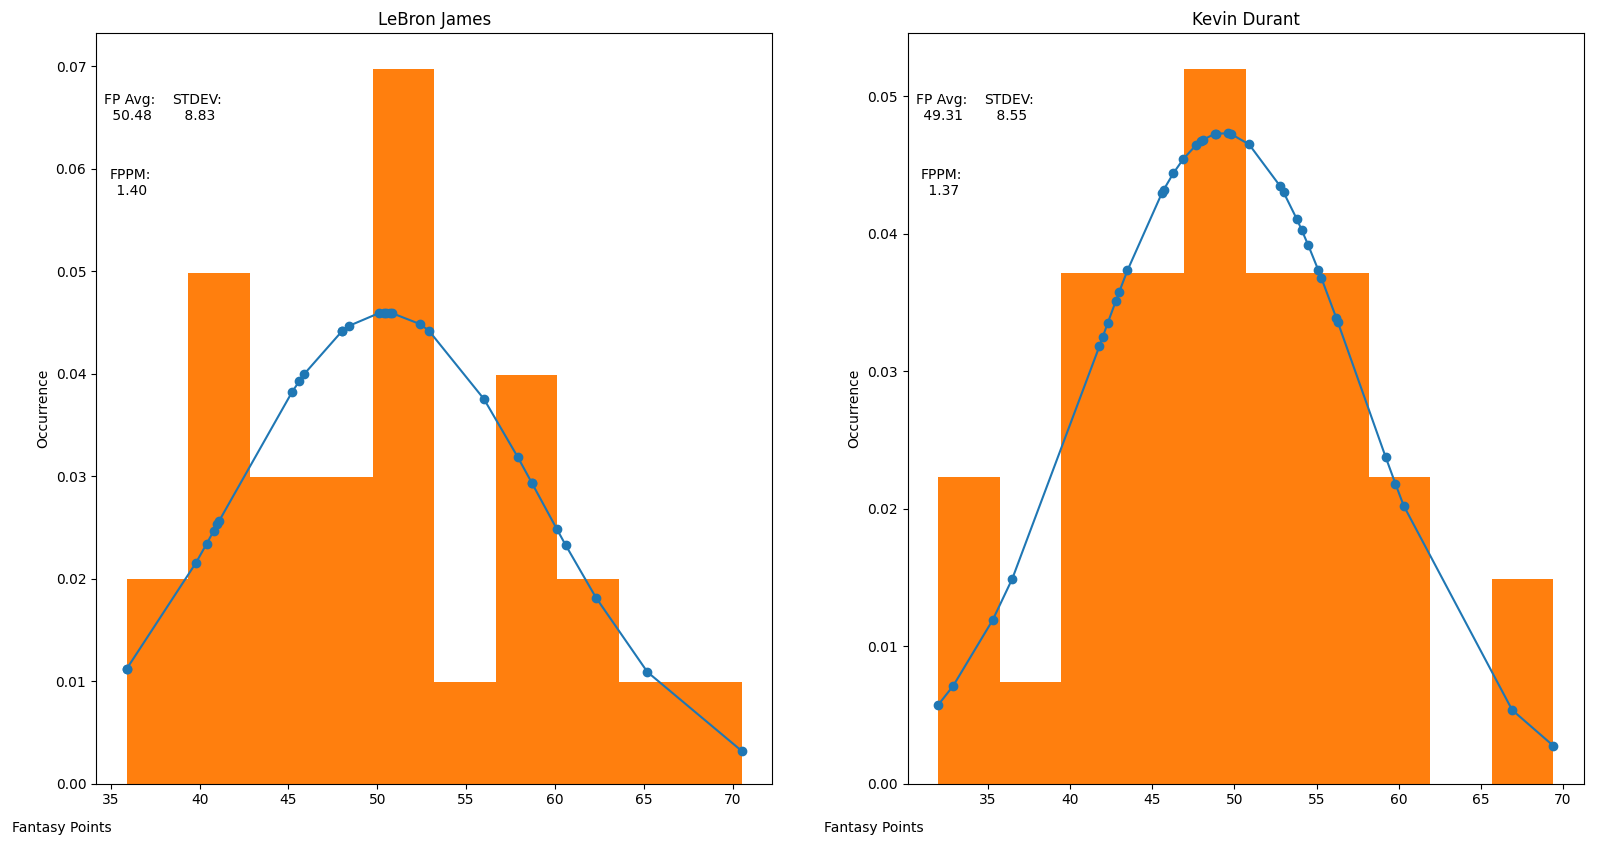
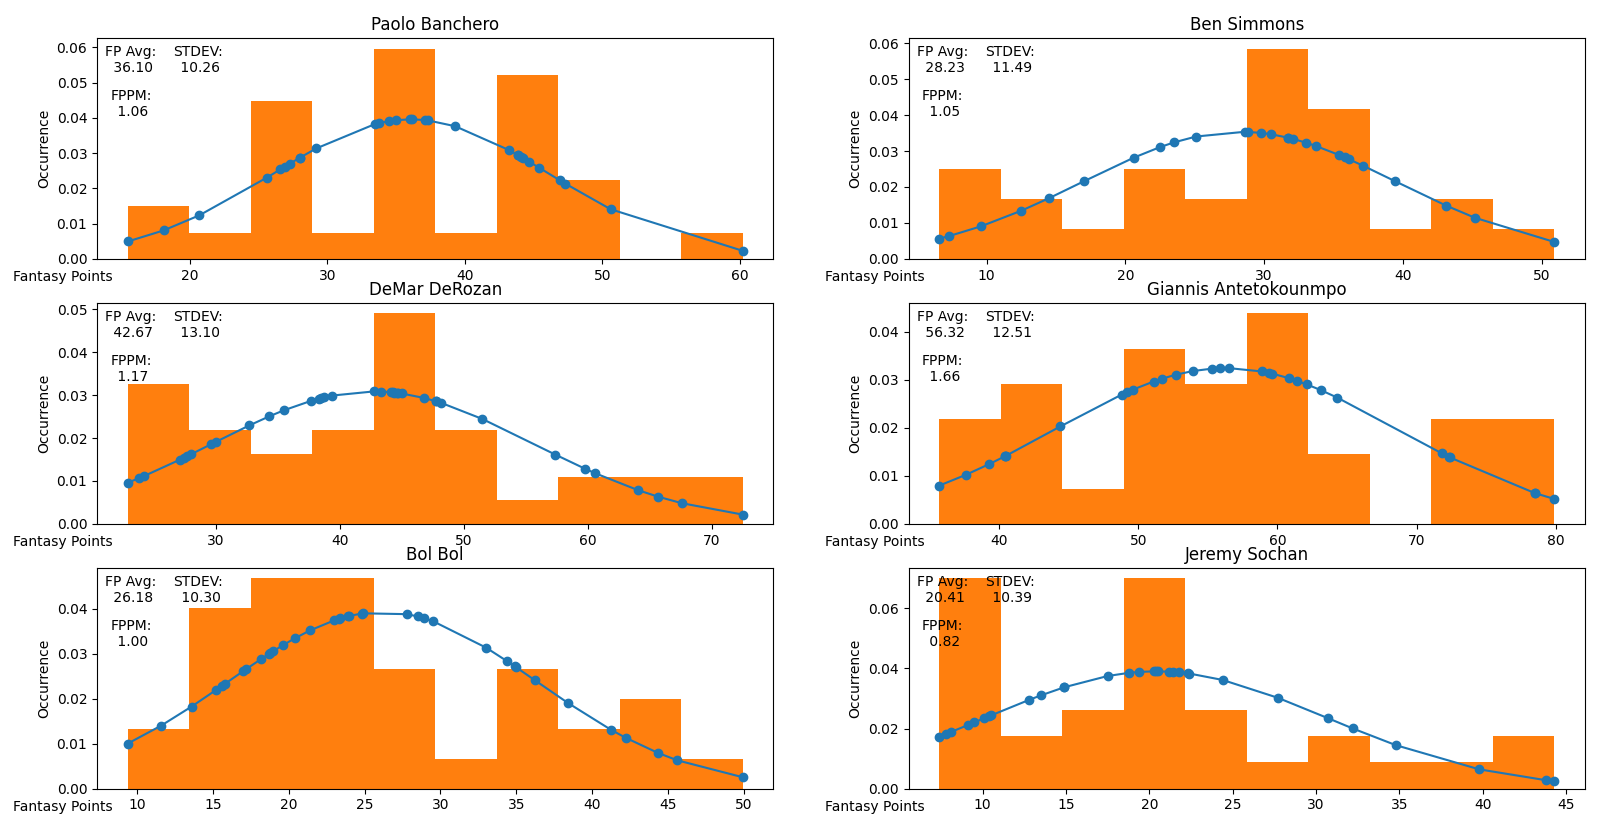
Bell Curve
In addition to evaluating temporal trends, it can also be valuable to determine a players consistency in scoring points. The bell curve allows for visualization of players consistency with respect to their average fantasy point production. In addition, Standard Deviation and Fantasy Points per minute are specifically calculated for direct comparison to other players
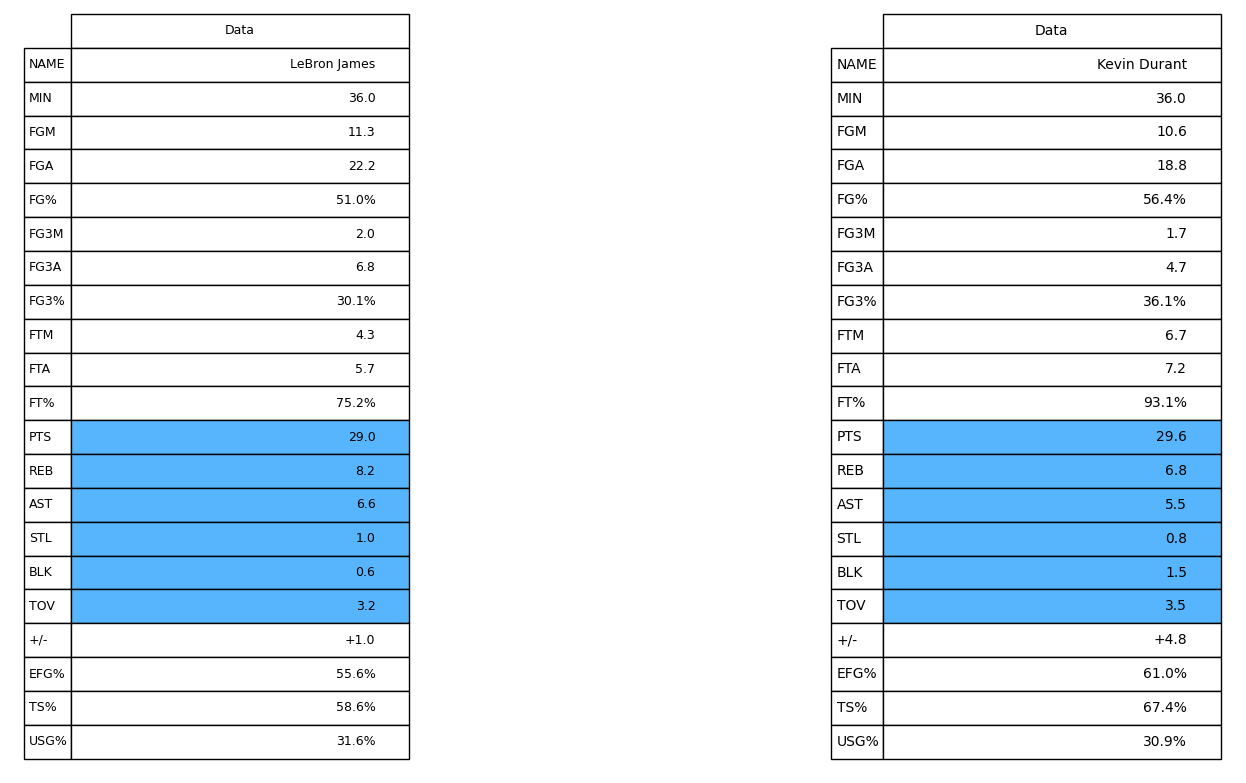
Basic and Advanced Stats
Basic and advanced stats allow for comparison of players from a traditional basketball statistic perspective. Relevant basic and advanced metrics are displayed and compared.
Practical Use
Comparison of up to 6 players allows for fast and easy comparison between multiple players when trades are proposed.
Taking It Further
With the ability to pull a multitude of data and plot into graphs or display in table form, the possibilities are endless for statistical comparison and data visualization.
However, there are still issues within the program that can be improved or optimized. This includes the ability continually compare without needing to restart program, optimization of calls to the API to improve program speed, explore more suitable data structures to handle information, Improve quality of graph and table layout.